
Looking beyond billions: what R&D intensity tells us about innovation, risk, and the race against time
Access and read the full newsletter here (6th September 2025)

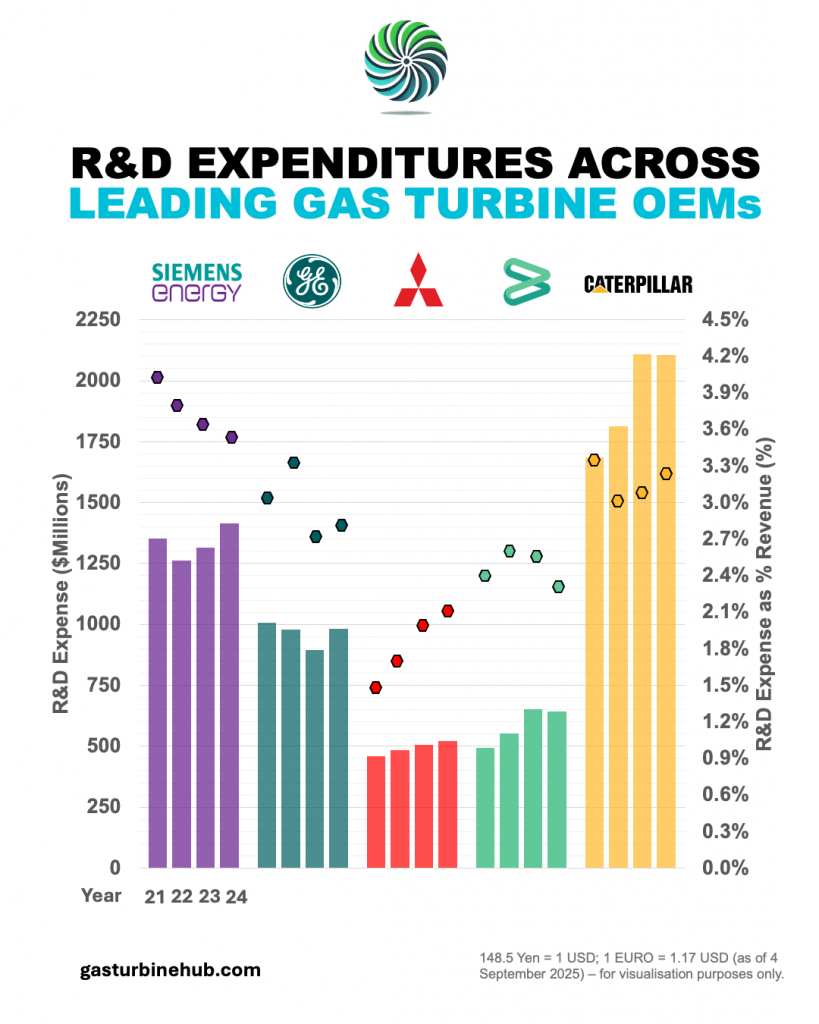
Dual-Metric Insight: Absolute Spend vs. R&D Intensity
The chart combines bar graphs (absolute R&D expenditure) with overlayed dots (R&D as a share of revenue), offering a layered perspective. This duality highlights not just which OEMs spend the most in total, but also which are investing proportionally in innovation.
Provocative Contrast Raises Insightful Questions
The visual’s design encourages deeper inquiry: Are high-spending OEMs truly focused on future-readiness, or are they plateauing in incremental gains? The contrast between scale and intensity promotes strategic reflection.
Clear, Spot-On Messaging
It delivers a strong narrative at a glance: the juxtaposition of spending magnitude and relative investment triggers critical thinking—resonating with the theme “Are we investing enough in the future?”